|
Profit from Manufacturing |
||
|
Seeking Veracity |
greytrek.com |
|
|
Profit from Manufacturing |
||
|
Seeking Veracity |
greytrek.com |
|
| Now we're going to invent a little
scenario in an attempt to explore, understand and study a few things we
ought to know about investing money. This is as much for my
benefit as anything else.
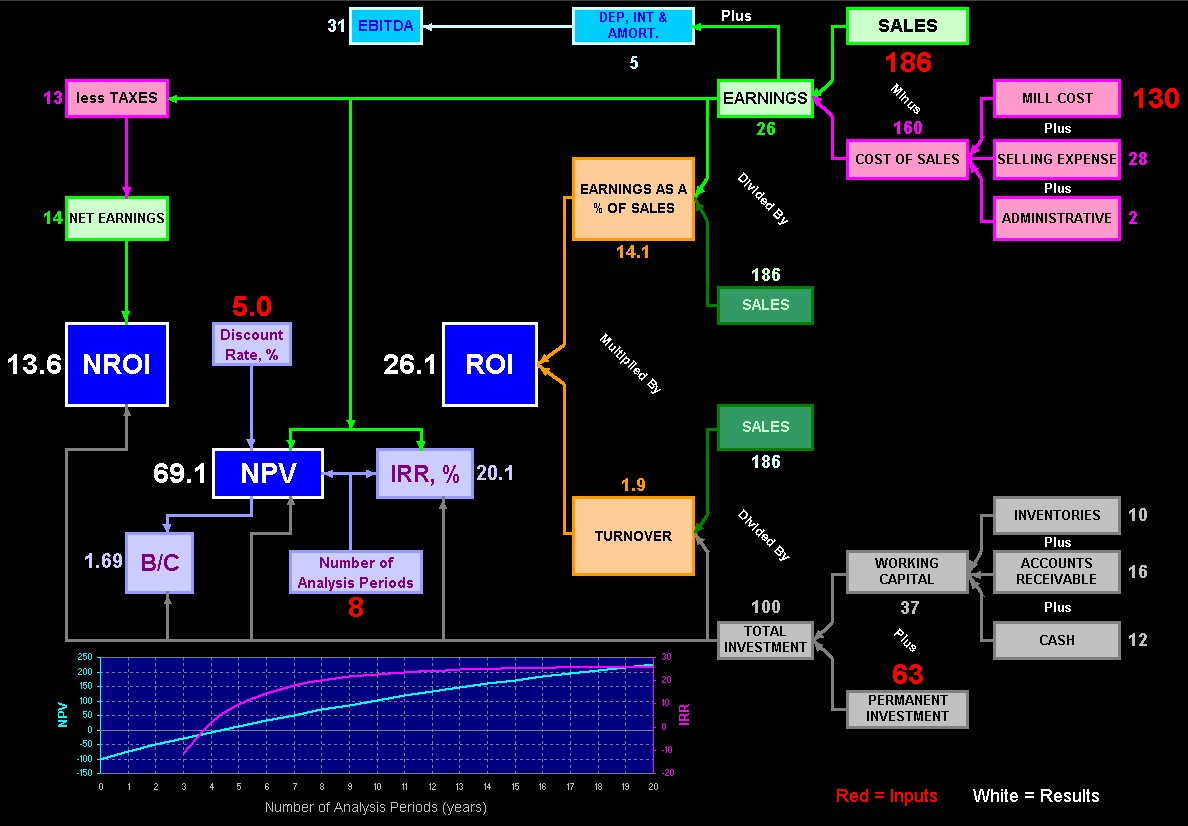
A chemical manufacturer is profitable and wants to expand their operation at an existing site. Cash is available to invest. Their Research and Engineering Departments are capable of developing the basic data, doing conceptual and final design, constructing the manufacturing facility, and bringing the new chemical plant on-line successfully. So enough engineering has been completed to estimate the Project Cost, plant management is able to estimate the Mill Cost, and enough market development has been completed to forecast Sales revenue for a number of years. The plant is expected to show a good Return on Investment, ROI, which is calculated by dividing Earnings by the Total Investment. In our case below, it is about 26%/yr. This is a lot better investment than purchasing financial market securities and receiving interest income. Today, that would only be about 5%/yr and some would call this the Cost of Capital. ROI, the financial end result of operations, can be shown as the product of two percentages . . . Earnings as a percent of Sales multiplied by Turnover, which is Sales as a percent of Total Investment. If these two underlying fractions are multiplied together, Sales cancels out leaving Earnings divided by Total Investment which is Return on Investment. The formula is set up in this manor so that the separate effects of Earnings as a percent of Sales and Turnover upon Return on Investment can be determined. Earnings as a percent of Sales reflects the success (or lack of success) in maintaining satisfactory control of costs. Turnover reflects the rapidity with which the capital committed to the operation is being worked. Thus the manager of our new plant can improve his return by reducing costs or working existing investment harder, both of which factors are within his control. But there are other financial tools that can be used to assess future performance of the new facility. Here is a Cash Flow chart showing the Project Cost, $100MM, and net Revenue, in $MM, over the first eight years of operation. We assume the facilities are in place, ready to operate at name plate capacity, and paid for. Production and Sales commences at the start of the first Period and revenues are received at the end of each Period. |
||||||||||||||||||||||||||||||||||||||||||||||||||||||||||||
|
||||||||||||||||||||||||||||||||||||||||||||||||||||||||||||
|
If we were in the possession of our periodic future Cash Flow amounts now, each one would have to be discounted. In other words, money at some time in the future is worth more than if we presently had it. Or another way to explain it, if we had it now, we could put it in the bank and receive interest. So we need to adjust each Cash Flow, C, value and calculate the Present Value, PV = C / (1+r), for each. |
||||||||||||||||||||||||||||||||||||||||||||||||||||||||||||
|
||||||||||||||||||||||||||||||||||||||||||||||||||||||||||||
| One of the best methods to evaluate a project investment is to use the Net Present Value, NPV = Σ PVi . You can determine the NPV from the start to any period in the project life. As can be seen from the calculations below, a positive NPV, is the accumulated, discounted (using the Cost of Capital) profit past the break even point. | ||||||||||||||||||||||||||||||||||||||||||||||||||||||||||||
|
||||||||||||||||||||||||||||||||||||||||||||||||||||||||||||
| Another useful tool in evaluating a capital project investment is the Internal Rate of Return, IRR. This must be calculated by trial and error and is the interest rate that produces a Net Present Value of zero for any period. For a favorable project, the IRR will be higher than the Cost of Capital. The more conservative, Modified Internal Rate of Return, MIRR, is considered an improvement by some because reinvestment at the Cost of Capital rate of return is used. However, NPV is usually preferred since it is easier to use, easier to understand, and more conservative than relying on the IRR. | ||||||||||||||||||||||||||||||||||||||||||||||||||||||||||||
|
||||||||||||||||||||||||||||||||||||||||||||||||||||||||||||
| The Benefit to Cost Ratio, B/C, is another tool to assess the performance of an investment. It is defined as the (NPV + Initial Investment) / Initial Investment | ||||||||||||||||||||||||||||||||||||||||||||||||||||||||||||
|
||||||||||||||||||||||||||||||||||||||||||||||||||||||||||||
|
|
||||||||||||||||||||||||||||||||||||||||||||||||||||||||||||
|
The next chart Illustrates the calculation paths for all of the financial quantities that we have discussed here. It is based on the traditional way the DuPont company assessed the performance of their investments, but with some additional features that were used later in the 20th Century. It's all still valid today! Another term you'll see on this chart is EBITDA (Earnings Before Interest, Taxes, Depreciation, & Amortization)
If you don't have Excel, here is an image of the Excel chart . . . Click Here |